U.S. State Exports to China 1999-2008
1998至2003年美国至中国的出口额
U.S.-Sino trade has blossomed in the past decade. An interactive map of state exports and trade growth to China since 1999.
在过去的十年中,美国之间的贸易量逐渐上升。这片互动地图表示从1999年以来,从美国到中国的出口额以及贸易量方面的发展。
by Craig Stubing
Date Published: 11/30/2009

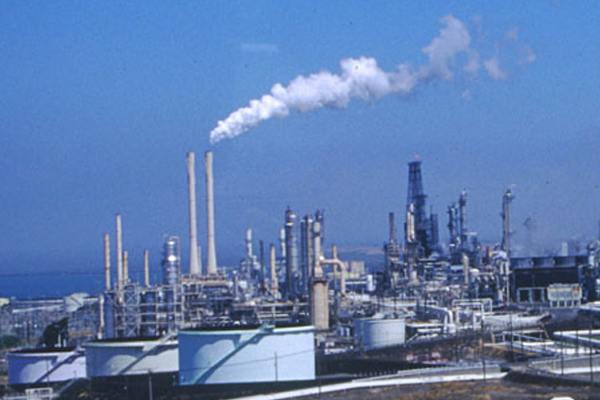
A factory located in the San Francisco Bay Area. Image taken by flickr user: Vlad & Marina Butsky
Scroll over each state to view its total trade with China. Move the slider to change which year is represented in the map. Press Play to visually see how trade has changed over time.
You need to upgrade your Flash Player
Top 10 State Exporters to China
| 1999 |
|
|
2008 |
|
|
California
|
$2,394,723,000
|
|
California
|
$10,981,739,000
|
|
Washington
|
$2,040,481,000
|
|
Texas
|
$8,421,576,000
|
|
Texas
|
$899,735,000
|
|
Washington
|
$8,309,842,000
|
|
Florida
|
$739,674,000
|
|
Louisiana
|
$3,480,214,000
|
|
Louisiana
|
$663,751,000
|
|
New York
|
$2,815,128,000
|
|
New York
|
$584,829,000
|
|
Illinois
|
$2,512,808,000
|
|
Illinois
|
$437,953,000
|
|
Oregon
|
$2,468,784,000
|
|
Massachusetts
|
$331,73,000
|
|
Georgia
|
$2,002,011,000
|
|
Pennsylvania
|
$263,345,000
|
|
North Carolina
|
$1,942,944,000
|
|
Ohio
|
$244,756,000
|
|
Ohio
|
$1,818,909,000
|